Pulaski County is located in the state of Virginia. The population is 34,768.
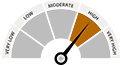
There are 10 public schools in Pulaski County with an average Homefacts rating of B-. There are 23 registered sex offenders residing in the county. Unemployment in Pulaski County is moderate and the median home sales price is $0.