Salem, Virginia

Population NR

Salem is located in Salem City County, VA. The population is , making Salem the largest city in Salem City County.

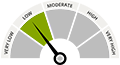
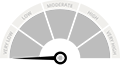
There are 12 public schools in Salem with an average Homefacts rating of A-. The total crime rate for Salem is low , and there are 2 registered sex offenders residing in the city. Unemployment in Salem is moderate and the median home sales price is $0. Detailed and up-to-date Salem property reports are available for any property address.

Cities near Salem include Glenvar, Cave Spring and Roanoke.

Salem Neighborhood Report

Schools

School Rating is Excellent
  • No High School Diploma: 10%
  • High School Graduate or Higher: 57.8%
  • Bachelor's Degree or Higher: 32.2%

Crime Rate

8.36% Lower than national avg.
  • Auto theft: 156
  • Violent Crimes: 90
  • Robbery: 20
  • Burglary: 180
  • Property Crime: 2
  • Larceny Theft: 1

Registered Offenders

100.00% Lower than national avg.
  • 2 offenders in Salem
  • 0.00 offenders/10,000 residents

Environmental Hazards

258 Found nearby
  • Brownfields: 0
  • Registered Polluters: 14
  • Superfunds: 8
  • Tanks & Spills: 236

Unemployment

Moderate 3.1%
  • Virginia unemployment average: 3.2%
  • National unemployment average: 3.7%

Property Values

Median Property Value $0

Schools view all

12 Public Schools view public schools

Summary
There are 12 K-12 public schools in Salem, VA and 2 private schools. Homefacts rates Salem's schools as Excellent, with an overall A- rating.
2 Private Schools

Hopetree Academy

Salem Montessori School

view all 2 private schools

View All School Information

Crime view details

2 Registered Offenders search the registered offender database

View All Registered Offenders

Crime Index view report

*100 is national avg. Greater than 100 means higher crime, lower means less crime.
  • Total Crime Index
  • Violent Crime Index
  • Property Crime Index

Property Reports view all

38 Building Permits View All

  •  
  • In 2014, the city of Salem, VA issued 38 building permits. All permits issued were for Single Family Homes. All permits issued were for Single Family Homes.
  • In 2013, the city of Salem, VA issued 28 building permits. All permits issued were for Single Family Homes. All permits issued were for Single Family Homes.
All Housing Single Family Housing Multi-Family Housing

Building Permits By Year

Fair Market Rents

**Displaying data from Salem, VA
  • Property Type Rent
  • Studio: $660
  • 1 Bedroom: $750
  • 2 Bedrooms: $943
  • 3 Bedrooms: $1,273
  • 4 Bedrooms: $1,410

View All Home Reports

Environmental Hazards

258 Environmental Hazards

Health Hazards

  • Air Quality HEALTHY (385/400)
    Salem, VA has 96.25% good air quality.
    view all
  • Radon ZONE 1 COUNTY
    Salem, VA is a red zone.
    view all
  • UV Index MODERATE 4.32 Average
    Salem, VA is a moderate risk area for ultra-violet rays.
    view all

Weather

  • We're sorry! No Weather statistics found in our database.

Average Monthly Temperature

  • January 37.15°
  • February 40.62°
  • March 49.2°
  • April 58.63°
  • May 66.37°
  • June 75.31°
  • July 77.87°
  • August 77.12°
  • September 69.72°
  • October 59.02°
  • November 48.08°
  • December 42.48°

View More About Environmental Hazards

Natural Disasters

Probability of Natural Disasters for Salem, VA

Earthquakes
Salem, VA has a low risk of earthquakes.
Hurricanes
Salem, VA has no risk of hurricanes.
Hail
Salem, VA has a very high risk of hail storms.
Tornadoes
Salem, VA has a very low risk of tornadoes.

Demographics view details

Median Household Income

Median Household Income in Salem, VA: $48,056

Unemployment

Unemployment in Salem is 3.1%. It is lower than the state and national averages, 3.2% and 3.7% respectively

Workforce Breakdown

Blue Collar - 44.02%
White Collar - 55.98%

Politics

State Representatives

  • Gov. Terry McAuliffe
  • Sen. Tim Kaine
  • Sen. Mark R. Warner

City Representatives

  • Bob Goodlatte

Neighborhood Info

Thank you for visiting the city of Salem, VA.